What roofing, HVAC, solar, plumbing, and remodeling contractors actually pay per lead on Google Ads, Local Services Ads, and Meta — and what a good number looks like for your trade.
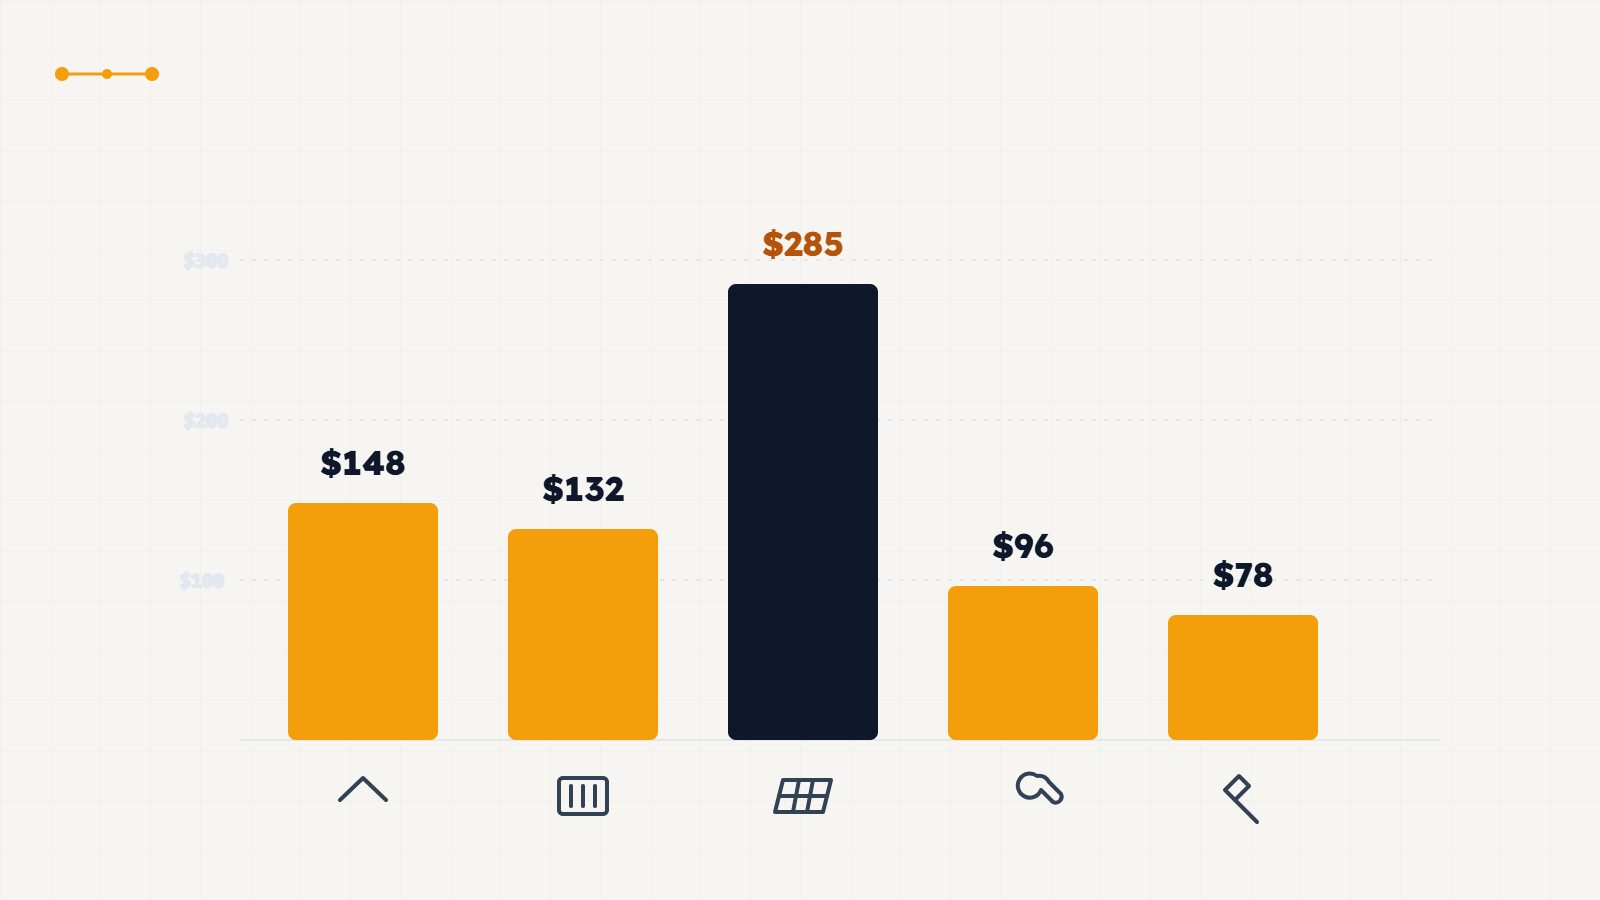
Cost per lead for home service businesses ranges from $30 to $500, depending on trade and channel. Roofing and HVAC run highest on non-branded Google Ads search ($124–$149 per lead in 2026 data). Local Services Ads cost 40–50% less than standard search. Solar carries the widest range due to longer sales cycles. These figures cover the two digital marketing channels that produce most home services leads — paid search and Local SEO — not directory referrals or word-of-mouth. Web Pinnacles client campaigns have landed as low as $11.67 per lead — 572 leads in 31 days for a roofing client, against a $124 trade benchmark. CPL is only the acquisition cost, though — see our complete guide to home service lead generation for how that cost turns into a booked job.
Non-branded Google Ads search is the most expensive channel for every trade below — and the most directly comparable to "cold" customer acquisition. Local Services Ads and Meta typically run lower, with tradeoffs in lead volume and qualification. See our full guide to how Local Services Ads pricing, verification, and disputes work for the mechanics behind the numbers below.
| Trade | Google Ads (non-branded) | Google Local Services Ads | Meta Ads | Web Pinnacles client result |
|---|---|---|---|---|
| Roofing | $124 avg range $80–$256 |
$50–$162 | $115+ | $11.67 |
| HVAC | $149 avg | $60–$120 | $115+ | — |
| Solar | $150–$300 | Limited availability | $30–$90 | — |
| Plumbing | $167 avg | $40–$90 | ~$73 | — |
| Remodeling | $250–$450 | Limited availability | $60–$150 | — |
Branded search (people already searching your business by name) runs 60–70% cheaper than non-branded across every trade — but branded volume is capped by how many people already know you. Figures aggregated from PPC and Local Services Ads benchmark platforms tracking live home service contractor spend, Q1 2026.
Same channel, five different cost structures. Sales cycle length, average ticket size, and seasonal demand swing CPL more than the platform you advertise on.
Roofing CPL has the widest spread of any trade — nearly 10x between top and bottom performers. Storm-prone markets with active insurance claims look nothing like markets running on elective replacement, and that gap dominates the number more than agency skill does.
HVAC CPL swings hardest with the calendar. Summer cooling failures and winter heating emergencies both spike demand and CPC at once, which is why blended annual averages understate what contractors pay during peak weeks.
Solar carries the longest sales cycle of any home service trade, which is the entire reason its CPL range is so wide. A homeowner who fills out a form today may not sign a contract for weeks — pre-appointment education matters as much as the ad that captured them.
Plumbing converts faster than any other trade on this page — 12–16% of website visitors become leads, against a 3–7% range for roofing and remodeling. Emergency intent is what makes the higher CPL still profitable: same-day jobs close without a long nurture sequence.
Remodeling sits in the same premium-CPL bracket as roofing — kitchen and bath leads commonly run $250–$450 — because the average project value justifies it. A $400 lead is cheap against a $20,000 kitchen remodel, which is why CPL alone is the wrong metric to optimize for in this trade. Cost per booked consultation matters more.
Roofing CPL drops 23% between winter and spring. HVAC CPC runs 3x higher at peak than off-season. The channels that work best during a slow season aren't the same ones that win during peak demand.
Off-season is when non-branded search gets cheapest — less competitor bidding means lower CPCs for the same keywords. Don't pause campaigns; a paused account loses its learning data and restarts cold when demand returns.
Slow season is the right time to run retargeting and brand-awareness campaigns instead of pure cold prospecting — cheaper impressions, and it builds the audience that converts when demand picks back up.
Ranking gains made during the off-season are still in place when peak demand hits — this is the highest-leverage time to build citations, earn reviews, and publish content, since map pack movement takes months regardless of season.
Review requests sent during slower months get more attention from customers than during peak-season crunch. A steady review velocity built off-season compounds into cheaper organic and referral leads once demand returns.
There's no published industry ROI figure by channel for slow-season performance specifically — treat any exact percentage you see elsewhere as an estimate, not a benchmark. The strategic tradeoffs above hold regardless of the exact number.
A low CPL means nothing if the lead never books. These are the numbers that determine whether a cheap lead is actually a good one — comparing paid placement against organic search engine rankings. See our full breakdown of how to calculate real lead value by trade for the formula behind these numbers.
| Metric | Paid Ads (Google / Meta) | Local SEO (organic) |
|---|---|---|
| Time to first leads | 7–14 days | 3–6 months for ranking movement |
| Cost per lead, ongoing | Fixed, per click/lead | Near-zero once ranked |
| Site conversion rate | 5–15% (trade-dependent) | 5–15% (trade-dependent) |
| Lead-to-booked-job cycle | ~60 days avg | ~60 days avg |
| Compounding value | Stops when spend stops | Builds over time |
See the full local-vs-paid breakdown in Why Home Service Businesses Fail at Local SEO. Most contractors need both running at once — speed from paid, compounding cost efficiency from organic.
That 60-day average blends several distinct stages — lead to first contact, first contact to booked appointment, appointment to estimate, and estimate to signed job — and they move at very different speeds. Emergency trades like plumbing and HVAC often compress the whole cycle into days; higher-consideration purchases like remodeling and solar spend most of those 60 days in the estimate-to-signed-job stage, where the homeowner is comparing quotes.
Cost per lead tells you what you're spending. It doesn't tell you whether that spending makes sense — a $250 lead can be cheap and a $30 lead can be a loss, depending on what it's worth once it closes.
Worked example: a $12,000 roofing job at a 25% close rate and 35% margin gives a $1,050 ceiling — nowhere near the $124 non-branded benchmark above. A $250 remodeling lead against a $20,000 project clears the same math easily, which is why CPL alone is the wrong metric to chase in this trade. The benchmark tables on this page tell you what the market pays; this formula tells you what you can afford to pay.
The benchmarks above tell you what a lead costs. Forecasting turns that into a monthly budget you can actually plan around — useful whether you're setting next quarter's ad spend or scoping a new market or location.
Work it forward with the benchmarks on this page: divide planned spend by your trade's CPL to get estimated leads, apply your site conversion rate from the table above to get qualified leads, then your own appointment and close rates to get closed jobs. Multiply by average job value for projected revenue, and divide spend by that revenue for a real cost-to-revenue ratio — not a guess.
This is also how to size a new market or a franchise expansion before committing budget: run the same math against the new territory's expected ad costs and your historical close rate, rather than assuming the numbers from an established market will hold in a new one. Book a free audit for a forecast built on your actual numbers instead of blended industry averages.
Ready to put your own numbers against these benchmarks? See how the pieces fit in our home service marketing services, or go straight to Meta Ads for your trade: Roofing HVAC Solar Plumbing Remodeling.
One verified result, against the trade benchmark it competes with. No blended averages, no rounding up.
A roofing contractor was paying $47 per lead through a generic agency before switching to the Booked-Job Pipeline™. Inside 31 days, cost per lead dropped to $11.67 — 90% below the $124 non-branded benchmark for roofing — with every lead attributed to its source.
Benchmarks are averages across many accounts and markets. Your actual CPL depends on your specific market, competition, and campaign maturity. Book a free audit for numbers specific to your business.
The exact audit we run before taking on a new client — see where your site is leaking booked jobs.
Book your free 20-minute audit. We'll show you your real cost per lead, where it compares to these benchmarks, and what's leaking budget before we touch a dollar of your spend.